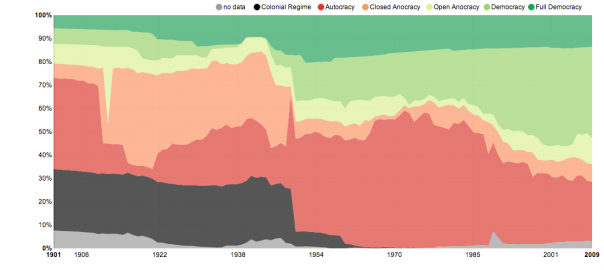
There are so many kinds of visualizations! Among them are stacked area charts — ever looked at or made one? Aside from their colorful visual appeal, they show information about items or topics in a category over time. They can be interactive or static.
One example of this type of chart is about causes of death. This visualization by Nathan Yau (of the website Flowing Data) reveals the prevalence of various reasons for death. It is organized by gender or race. Because it is interactive, the viewer can isolate a particular gender, race, or cause of death.
So what can you learn from this kind of visualization?
- It gives a broad view of a topic. It can answer a question like, what are common causes of death for women? It cannot answer a question like, how many people die from external causes each year? (Some stacked area charts do give counts, though.)
- It is ideal for making general comparisons. In addition to viewing percentage differences between the causes, you can see general patterns and trends, such as, how do men and women compare?
- It can inspire more research. When you notice a trend, such as “external causes” as more prevalent at younger ages, it raises questions. What do “external causes” include? Why might that be a more common cause for young people? Go to the original data, as well as other sources of the same information, for more background and potential answers.
Other examples of this type of chart include one about political systems (pictured above) and what fills people’s time.
What stacked area charts have you encountered? Do you have a different “favorite” visualization?
Image: “The Shares of World Citizens living under different political systems – Max Roser” by Max Roser on Our World in Data. CC By-SA. http://ourworldindata.org/data/political-regimes/democratisation/
