Hop over to our conference web page to register. It’s free, and there are some amazing ideas and presenters awaiting you!


Hop over to our conference web page to register. It’s free, and there are some amazing ideas and presenters awaiting you!
Thanks to American Libraries for featuring our IMLS-funded data literacy project in this month’s issue! An excerpt:
Building professional capacity
Teacher-librarians are well positioned to impart data literacy to teens, but who’s giving instructors the resources and support that they need to do so?
Kristin Fontichiaro, clinical associate professor at University of Michigan’s School of Information, and Jo Angela Oehrli, learning librarian at University of Michigan Library, were up for the task. As principal investigators of the two-year IMLS-funded project “Supporting Librarians in Adding Data Literacy Skills to Information Literacy Instruction,” they set out to design materials for high school librarians looking to foster data and statistical literacy skills in their students.
“We were seeing on our own campus that data was becoming a powerful mode of expression and wasn’t working in ways that information literacy always works,” says Fontichiaro. With help from data and curriculum experts at the University of Michigan, Inter-University Consortium for Political and Social Research, and colleges across the country, she and Oehrli developed virtual conferences, handbooks, webinars, and discussion questions.
Materials cover strategies for introducing teens to data and its usage, visualizations, and privacy topics, such as the implications of data collection by always-on devices like Fitbit or Amazon Echo. Though the initiative formally wrapped in September 2017, all deliverables—including the two books, Creating Data Literate Students and Data Literacy in the Real World: Case Studies and Conversations—are available for free on the project website.
“It’s not enough to have open data. You have to have people navigate that data, know it’s there, and know how to use it,” Fontichiaro says. “Our real goal was for librarians to be empowered, and our workshops show that when librarians and educators know more, they do more.” Materials were designed to be high impact for the school librarian who might not have time to teach a full lesson.
The virtual conferences provided insight into who is interested in these resources. “The first year we had over 80 different job titles sign up, from folks who work at state departments of education or government agencies to classroom teachers,” says Fontichiaro. About one-third of the audience consisted of high school librarians.
The information climate also affected people’s motivation for attending. “In 2016, we asked a registration question: ‘Why is it important for students to be data literate?’ And many people said, ‘Well, they need to make infographics.’ In 2017, the big answer was ‘to participate in elections.’” By demand, a third virtual conference is planned for July.
“I believe that an informed democracy makes better decisions, so I think this is a critical life skill,” Fontichiaro says, “especially in the era of artificial intelligence and algorithms.”
Call it fake news, bad information, or merely a well-intentioned reporter whose nose for news outweighs his/her data skills … learning to comprehend data in the news is tougher than ever before.
In this June New Yorker article, Michelle Nijhuis shares some of the strategies from the University of Washington’s course “Calling Bullshit in the Era of Big Data,” taught by Jevin West and Carl Bergstrom.
Here are some tips they recommend:
A while back, we showed you retired Microsoft CEO Steve Ballmer’s USAFacts site, which he built with a team to help Americans discover how the U.S. budget is being spent.
Back in May, team member Connie Williams shared the beta site for USASpending.gov (slowly transferring over to the “actual” site over the summer), which is a federally-mandated site for viewing government data.
Why not take both for a spin and think about how a compare-and-contrast task like this could be beneficial to your students?
We caught up in May with Eleanor Tutt of Carnegie Library of Pittsburgh, who also has funding from IMLS to work on data but with a focus on citizen engagement with data. Here’s an excerpt from a blog post outlining some of their work:
Data seems to come up in all sorts of conversations these days, and they reach way beyond math class. For example, civic data—which includes information about our city and citizens—is a great way to engage with your community on a deeper level, and can be a powerful tool for change! Since civic data is about the people and places you see every day, it can be tough to notice. Based out of CLP-Main, the Civic Information Services team is helping to uncover and share the ways data fits into life at the Library and throughout Pittsburgh, and we have a lot of fun stuff in store.
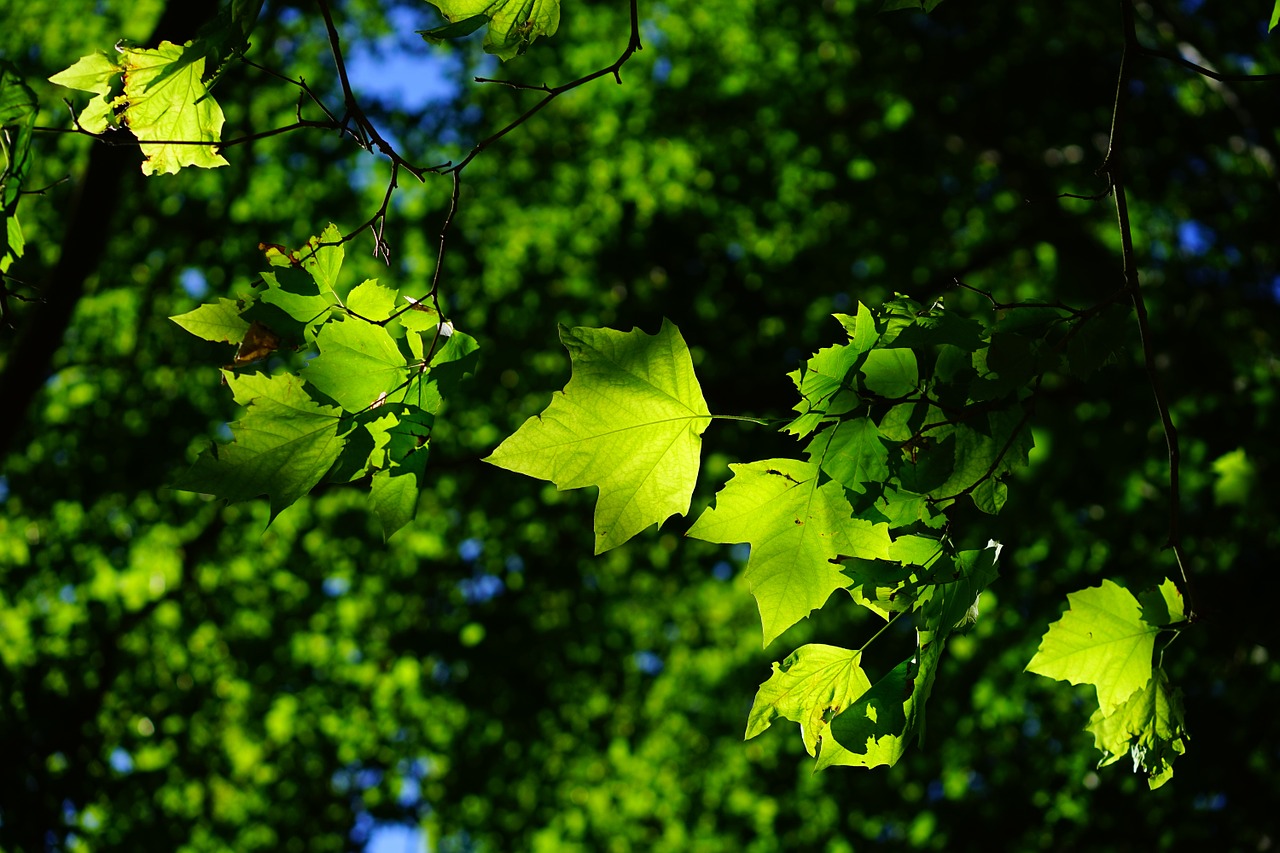
The STEM Committee has been busy sowing the seeds for their Super Science Kits, and we just couldn’t wait to join them. Some of our favorite collaborations so far can be found in the Tree Kit. Two activities included in this kit feature data front and center: “Forest Logbook” and “Make a Tree Map.”
Have you ever kept a nature journal? Ever taken notes while walking in the woods? Surprise! You were actually collecting data. The “Forest Logbook” activity invites you to tame wild data with a pencil and paper. While on a short nature walk around the library, kids will keep a close eye on the plants and animals they encounter, making notes as they go. Collecting nature data is especially exciting because we can measure anything from the size of a tree trunk to the furriness of a squirrel’s tail. And what fun would our data be if we couldn’t share it with friends? The group is encouraged to share and compare data with each other, which gives us the chance to spot similarities and differences. This activity serves as an easy introduction to observation and collaboration, both of which are crucial steps in data collection. While the trees are busy making oxygen outside, do you ever wonder what’s up with the air in your own home? You can check out one of our Speck Air Quality Monitors for some super practical data collection.
Pittsburghers are really lucky when it comes to data, because the Western Pennsylvania Regional Data Center gives us access to a bunch of cool civic information, from playgrounds to bus stops. The dataset we use for our “Make a Tree Map” activity was created by the City of Pittsburgh. Taking a close look at data and comparing it to what we see outside is an important part of data literacy, as we can use that step to determine why and how data is collected. After that, it’s time to create our own tree maps! Because we can create our map using characteristics from climbability to circumference, each one will be a totally unique look at the same set of data.
Sound fun? Read the rest of the post here. Also, here’s some trivia: at the time of his retirement, my great-uncle was the longest-serving employee at this library system, having spent over 40 years as a bookbinder.
Image: Pixabay.com (public domain)
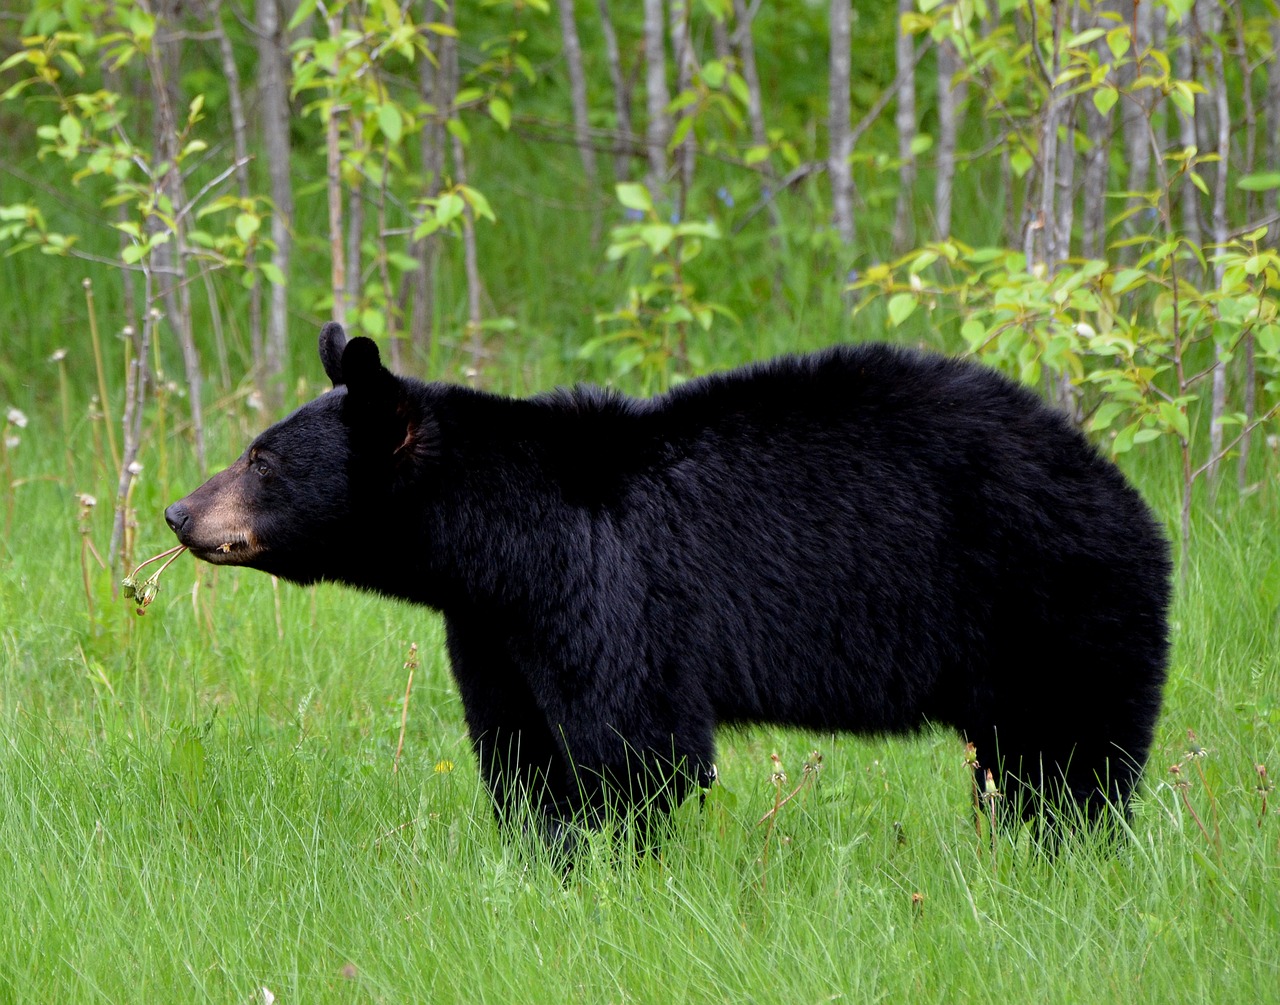
Here’s a snip of a cool article from the Smithsonian that reminds us that while data collection and sharing can be great, sometimes data’s immediacy can cause new problems and it’s important to put the brakes on. Sure, park rangers at Yosemite want to help visitors learn what bears do and how they move, so why not share the GPS data of some bears? At the same time, some tourists to the park, armed with real-time data, might use it to find bears … and that disrupts things. From the article:
Hundreds of black bears amble through … Yosemite National Park in California … [N]ow, thanks to a new tracking system, fans of the furry animals can follow the creatures’ meandering paths—from the safety of their couch.
As Scott Smith of the Associated Press reports, the park recently launched a website called Keep Bears Wild. One of the site’s main features is the aptly-named “Bear Tracker,” which traces the steps of bears that have been fitted with GPS collars. But the animals’ locations are delayed, Ryan F. Mandelbaum reports for Gizmodo, so curious humans aren’t tempted to scout the bears out. Rangers can turn the data on and off, and tracks will be removed during fall and winter to ensure that the bears can hibernate peacefully.
The goal of the project is to educate the public and whet the appetite of bear enthusiasts, without putting anyone in danger …
These may seem like intuitive precautions, but bears are repeatedly threatened by their interactions with humans. More than 400 of Yosemite’s bears have been hit by cars since 1995, according to the Keep Bears Wild site. And bears that feast on human food can become aggressive, forcing rangers to kill them “in the interest of public safety,” the site explains.
While the Bear Tracker provides limited data to the general public, it is also useful to park rangers, who can view the bears’ steps in real time. For the past year, a team led by wildlife biologist Ryan Leahy has been using the technology to track bears on iPads and computers, according to Ezra David Romero of Valley Public Radio News. And as Smith reports, rangers can follow GPS signals and block bears before they reach campsites.
The tracking devices also help rangers learn more about black bears’ behavior. The animals can traverse more than 30 miles in two days, the data suggests, and easily scale the 5,000-foot walls of Yosemite’s canyons. The trackers have revealed that the bears begin mating in May—one month earlier than previously thought.
An interesting ethics reminder that there are times when better access data could be unintentionally harmful …
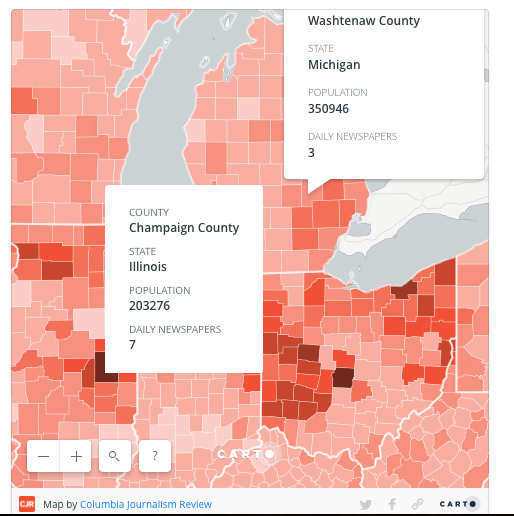
The Columbia Journalism Review has been assembling a national map showing “news deserts” around the United States. It’s utterly fascinating. In some states, like Nebraska, nearly half the state does not have a daily newspaper (or hasn’t reported one). How does that impact voting? Civic engagement? The sharing of local and beyond-local information among fellow citizens? What questions are raised when you look at it?