I keep mentioning this resource to folks, so I figured I’d post it here for you.
-Kristin
Thanks to the Nathan Yau of Flowing Data for this mesmerizing video of shifting U.S. population over time!
Kristin

The rise of big data can be traced back through history. Viktor Mayer-Schönberger and Kenneth Cukier chronicle its evolution and describe its current state in Big Data: A Revolution that Will Transform How We Live, Work, and Think. I couldn’t put it down!
One defining aspect of big data is its focus on “what” data say. In other words, big data reveals trends and patterns, but it does not explain why they appear or occur. Mayer-Schönberger and Cukier make this observation about correlation and causation:
[i]n a big data world…we won’t have to be fixated on causality; instead we can discover patterns and correlations in the data that offer us novel and invaluable insights. The correlations may not tell us precisely why something is happening, but they alert us that it is happening.
How does this point impact how you understand big data and its impact?
Source: Mayer-Schönberger, Viktor, and Kenneth Cukier. Big Data: A Revolution that Will Transform How We Live, Work, and Think. Boston, MA: Houghton Mifflin Harcourt, 2013.
Image: “Sunrise Sky Blue Sunlight Clouds Dawn Horizon” by PublicDomainPictures, on Pixabay. CC0 Public Domain.
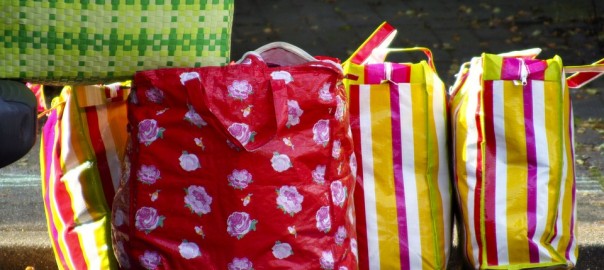
Numerical estimates, such as ballpark figures or “guesstimations,” abound in school, work, and our lives. For example, you can roughly calculate the impact of shopping with a reusable grocery bag, instead of using plastic bags, for a year. But how can anyone know that? How do we make sense of “guesstimations?” Are they even grounded in good mathematical principles?
Our team member Connie Williams shared a video of a talk by Dr. Lawrence Weinstein, a professor at Old Dominion University. In his lecture, “Guesstimating the Environment,” he points out that “guesstimations” are inherently imprecise. He covers the use of “guesstimations” in topics ranging from ethanol to windmills and considers issues by calculating estimates. While “guesstimations” are imprecise, they do provide a way to understand the scope of a problem.
Watching this lecture, or a portion of it, could spark a discussion about “guesstimations” in the news and academic resources with your students. Some questions to discuss include:
Dr. Weinstein also asks a key question about a “guesstimation:”
Is this a lot or a little?
It can be hard to know if a “guesstimations” is big or small. Consequently, Dr. Weinstein emphasizes the need to compare the numbers to something else. A comparison is a great way to make sense of numbers, whether they are estimates, actual counts, probabilities, or statistics. When creating or evaluating “guesstimations,” a helpful rule of thumb is to find something with which to compare it or help to put it in context. In the grocery bag example, he explains how to compare a person’s annual use of plastic bags to gasoline burned by driving her car. It turns out that the amount of plastic bags that an individual uses is insignificant compared to how much gas that her car burns. The lecture contains many more examples like this — have a look!
Image: “Bags Plastic Shopping Household Colorful Sunny” by BRRT, on Pixabay. CC0 Public Domain.
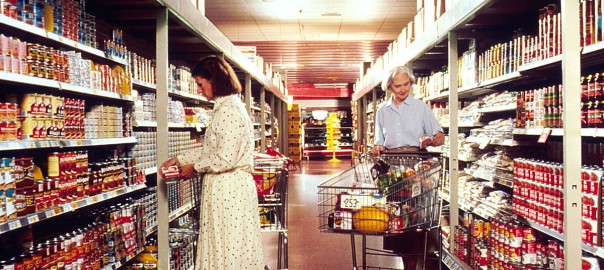
When used to make predictions, data can be quite powerful! A common example is the story of the retailer Target’s prediction of a customer’s pregnancy. When the company sent coupons for baby products to a teen, her father complained. However, it turned out that she was indeed pregnant. Such stories can be impressive and concerning. In addition to learning trends and patterns from data, data can lead to new information. In the case of Target and the teen, the store did not just know what the teen bought. Those data suggested more information: her pregnancy. As Eric Siegel writes:
[t]his isn’t a case of mishandling, leaking, or stealing data. Rather, it is the generation of new data, the indirect discovery of unvolunteered truths about people. Organizations predict these powerful insights from existing innocuous data, as if creating them out of thin air.
To understand how predictive analytics work, Siegel provides a wealth of examples and in-depth explanations in Predictive Analytics: The Power to Predict Who Will Click, Buy, Lie, or Die. Understanding how organizations glean information from data and use that information helps us understand marketing and decisionmaking today. It also helps us manage our personal data.
Source: Siegel, Eric. Predictive Analytics: The Power to Predict Who Will Click, Buy, Lie, or Die. Hoboken, New Jersey: John Wiley & Sons, 2013.
Image: “Women Grocery Shopping.jpg” by Bill Branson (Photographer), on Wikimedia Commons. Public Domain.

Interested in embarking on a citizen science project? One way to learn about the world around you is to take a sample. In fact, this spring the radio and podcast program, Science Friday, encouraged listeners to take samples, which sparked a variety of ideas from listeners.
So how do you go about getting a sample? As Charles Wheelan writes in Naked Statistics, it’s like soup! In all seriousness, best practice is to take a representative sample. Wheelan explains that:
[t]he key idea is that a properly drawn sample will look like the population from which it is drawn. In terms of intuition, you can envision sampling a pot of soup with a single spoonful. If you’ve stirred the soup adequately, a single spoonful can tell you how the whole pot tastes.
This soup analogy is informative. If a sample is not representative (or the soup is not well-stirred), we cannot make generalizations. Wheelan explains:
[s]ize matters, and bigger is better…it should be intuitive that a larger sample will help smooth away any freak variation. (A bowl of soup will be an even better test than a spoonful.) One crucial caveat is that a bigger sample will not make up for errors in its composition, or “bias.” A bad sample is a bad sample.
From a sample, we may learn something about a population, but we must take care not to overgeneralize. For more on samples and other statistical concepts, Naked Statistics is a useful primer and one of the books that our team has enjoyed.
Source: Wheelan, Charles. Naked Statistics: Stripping the Dread from the Data. New York: W.W. Norton, 2014.
Image: “Pot Steaming Hot Cooking Kitchen Stove Cooker” by Republica, on Pixabay. CC0 Public Domain.
One way for you and your students to get your feet wet with data is citizen science. Citizen science endeavors involve collecting data, which make such projects great activities for applying data literacy skills. In fact, citizen science is one of our themes for the second year of this project, starting in the fall!
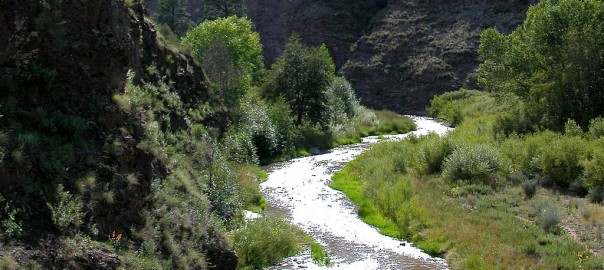
For ideas to embark on a citizen science project, check out the book, Diary of a Citizen Scientist: Chasing Tiger Beetles and Other New Ways of Engaging the World by Sharman Apt Russell. Russell writes about her project to study the Western red-bellied tiger beetle by the Gila River (pictured above) in southwestern New Mexico. This book is mix of a diary, environmental messages, and how-to guide for being a citizen scientist. Her work will inspire you to dive into a citizen science project. Not only will you learn about Russell’s research but also about other citizen science initiatives, like Galaxy Zoo and Project FeederWatch.
Russell chronicles her successes and challenges, as well as reflects on her motivation for doing citizen science, in the book:
We all want to be part of something larger. We want to be part of a family, a community, a cause. We want to be part of something meaningful. Studies show that long-term happiness depends on this engagement. I personally want to advance conservation policy. I want to do real science. I want to learn more science.
It’s inspiring! This book is in the style of nature writing with both personal reflections and scientific information. Russell weaves stories and tips in with descriptions of her experiences. Reading her account makes a citizen science project seem manageable and provides a great introduction to citizen science.
Source: Russell, Sharman Apt. Diary of a Citizen Scientist: Chasing Tiger Beetles and Other New Ways of Engaging the World. Corvallis, OR: Oregon State University Press, 2014.
Image: “Middle Fork of the Gila River, SW New Mexico” by Joe Burgess, on Wikipedia. Public Domain.
We are looking forward embarking on the second year of our project in the fall! During Year Two, we’ll focus on a second set of themes. One of the areas is personal data management. Here’s a sneak peek of what that theme will cover.
Our actions, from using a cell phone to paying with credit cards, generate data. That data goes into the hands of companies and organizations. Often, we don’t know or have control of what they do with it. Use of this data can cause privacy issues. One common example is the Netflix contest for improving its movie recommendations, which went awry when researchers could re-identify Netflix customers despite the anonymization of the released data.
A recent study from the Columbia University Data Science Institute and Google revealed that individuals can be re-identified with location data from two accounts. As a preview to the issues we will start exploring this fall, check out that study.
Image: “Compass Navigation Map Direction Journey Travel,” by PDPics, on Pixabay. CC0 Public Domain.
In the first year of this project, we have focused on the themes of statistical literacy, data as argument, and data visualization. One book that supported our understanding of statistics and data in the wild is Stat-Spotting: A Field Guide to Identifying Dubious Data by Joel Best.
Statistics are formed from data. As Best writes, “[e]very statistic is the result of specific measurement choices.” Keeping this idea in mind is important when interpreting statistics that you encounter. Statistics are representations of data. They have been created to summarize data.
Best’s advice is easy to put into practice whenever you see a statistic. He writes:
…it is always a good idea to pause for a second and ask yourself: How could they know that? How could they measure that? Such questions are particularly important when the statistic claims to measure activities that people might prefer to keep secret. How can we tally, say, the number of illegal immigrants, or money spent on illicit drugs? Oftentimes, even a moment’s thought can reveal that an apparently solid statistic must rest on some pretty squishy measurement decisions.
Asking those questions is one way to be a more critical consumer of statistics. Try it!
Source: Best, Joel. Stat-Spotting: A Field Guide to Identifying Dubious Data, 2nd ed. Berkeley, CA: University of California Press, 2013.
Image: “Percent Characters Null Rate Symbol Percentage” by geralt, on Pixabay. CC0 Public Domain.
Oakland County educator (and U-M grad!) Jianna Taylor wrote on the Oakland Schools Literacy blog about her attendance at the 4T Data Literacy conference. She said, in part:
I attended multiple sessions, on topics ranging from an introduction to data literacy, to data literacy in the content areas, to action research in the classroom. For this conference, I was most looking forward to the sessions about data visualization and infographics, though. I’ve dabbled with making infographics and have always wanted to have students create them, but I was never sure how to go about doing that, because I didn’t feel that I had a design background.
As the presenters were speaking, something that one of them said really struck me: think of an infographic like an argumentative essay. The infographic itself is the overall argument. The images, design, and information are the evidence and reasons.
Thinking about infographics in this way was like a light bulb going off in my head. Writing arguments with supporting evidence is something students are well versed in, and moving from a traditional essay to a different argumentative form seemed like a great next step.
Thanks for the feedback, Jianna! You can read more of her reflection here.